High Impact Financial Analysis
  • Home
  • About High Impact
    • Our Team >
      • Join Our Team
    • Annual Reports
  • Underwriting
    • Green Lending
    • For Real Estate Lenders
    • For Business Lenders
    • For NMTC Allocatees
    • Multi-Lender Underwriting
  • Portfolio Management
    • Full-Service Portfolio Management
    • Data-First Portfolio Management
  • Analytics
  • MEDIA
    • Blog
    • Impact Lenders Podcast
    • Publications
  • CONTACT

Top 5 Dashboards for CDFIs

2/13/2024

0 Comments

 
Dashboards provide critical insights through visual representations of key data and trends that are easy to interpret and direct focus to the most important information and takeaways. Effective dashboard packages utilize a combination of Summary and Supporting schedules. Summary dashboards focus on KPIs as well as key trends, ratios, and metrics, while supporting pages provide more granular insights and can leverage interactive features to support deeper analytics. For example, while a summary page might focus on total portfolio growth, supporting dashboards would include insights on the funds, products, and/or geographies driving that growth.

So, what information should you include in a CDFI dashboard package? That depends on your audience. CDFIs have many different stakeholders—both internal and external—and they all need different information to meet their needs. Remember, information overload can be just as detrimental as a lack of information. Connecting stakeholders to the right information so they can act upon it is your primary goal in designing a dashboard package.

This is where our High Impact Portfolio Analytics service shines.  Once data modeling is complete, you have full control over which content your various audiences can access, and the data in the system can be used to create any number of targeted, interactive dashboards with specific audiences in mind. Here is our take on the top five dashboards that CDFIs need to ensure that the right data are available for the right stakeholders at all times.
#1: The CFO Dashboard 
CDFI CFOs have a lot to manage—not just income and expenses, but also asset-liability matching, deployment, and strategic planning. The perfect CFO dashboard gives key information on all of these topics.
  • Revenue data: Revenue by source versus budget.
  • Expense data: Expenses by budget category.
Picture
  • Cash position: Operating cash dollar amount and days’ cash on hand.
  • Financial health indicators: Deployment ratio and net asset ratio.
  • Delinquency data: 30-60-90-day delinquencies and dollar amount of nonperforming assets.
  • Maturities data: Upcoming maturities of both loans receivable and notes payable.

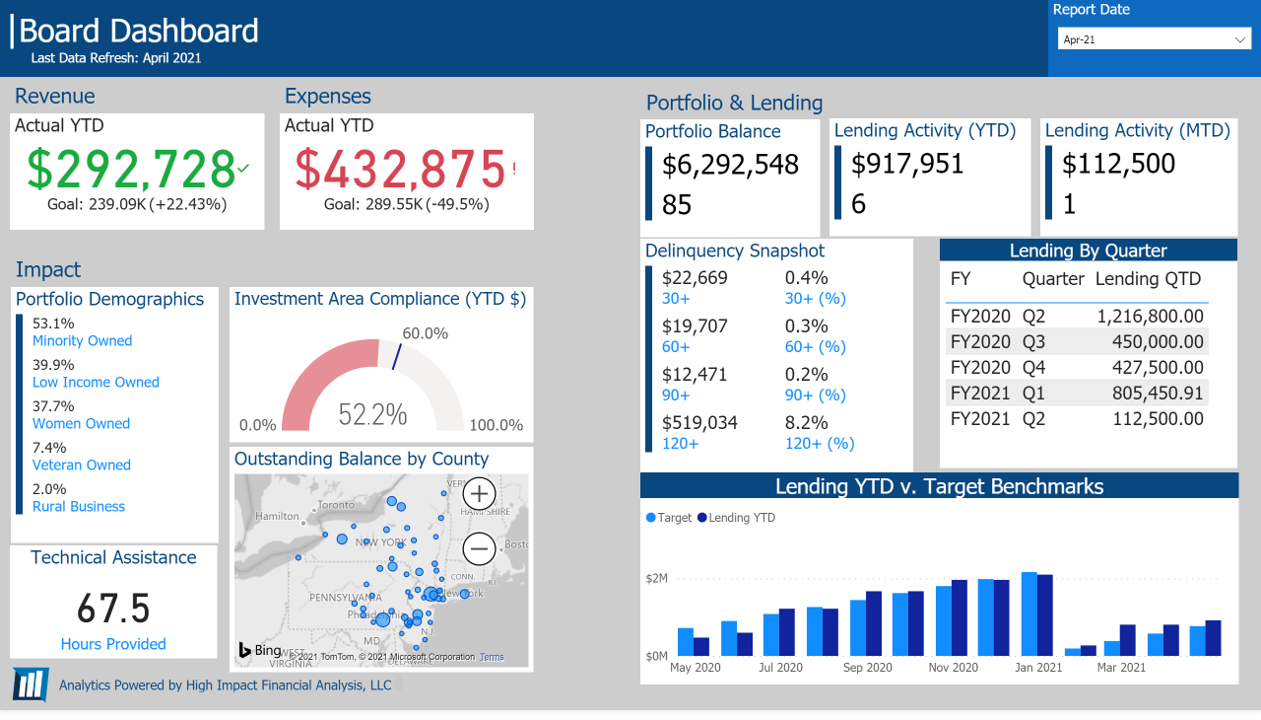
​#2: The Board Dashboard
CDFI Boards of Directors are responsible for the overall strategy and oversight of the organization. Their needs are best met by monitoring the big-picture numbers and strategic direction. Adding in a taste of impact is critical.
  • Top-line income statement data: Total income and total expenses against the budget.
  • Top-line lending data: Originations by quarter, loan portfolio outstanding balance, and 30-60-90-day delinquency.
  • Strategic plan benchmarks: Established strategic plan benchmarks with a numeric component that can be tracked with meters or other data visualizations to quickly communicate progress.
  • Impact data: Relevant indicators including financing to minority- and women-owned businesses, number of housing units financed, or number of technical assistance hours.

Picture
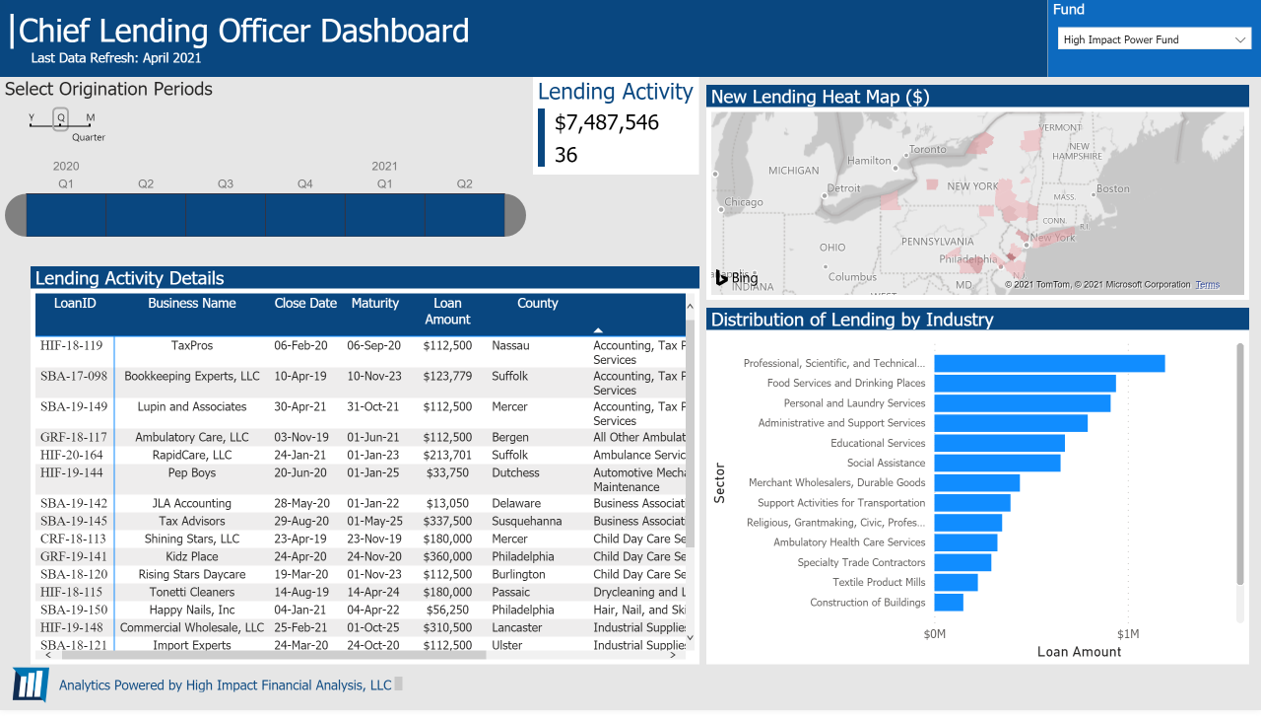
​#3: The Chief Lending Officer Dashboard
Chief Lending Officers are often charged with both generating originations and ensuring that only good loans are made. An effective dashboard will keep an eye on both.
  • Pipeline data: Number of loans and dollars of loans in the pipeline, segmented by stage in the pipeline, if available.
  • Originations data: Loans committed and closed versus budgeted originations.
  • Portfolio growth: Outstanding principal balance and outstanding number of loans over time.
  • Investment area: Year-to-date progress towards CDFI Fund lending area requirements.
  • Maturities data: Upcoming loan maturities.
  • Delinquency data: 30-60-90-day delinquencies and dollar amount of nonperforming assets.
Interest rate data: Weighted cost of loan capital and weighted average interest rate in the portfolio.
Picture
Picture
#4: The Resource Development Dashboard 
Staff focused on raising funds need to be able to effectively tell the impact story of the loan fund. Equipping them with clear, concise dashboards that communicate the success of the CDFI is critical.
  • Portfolio growth: Outstanding principal balance and outstanding number of loans over time.
  • Technical assistance: Hours and number of applicants and borrowers provided with technical assistance.
  • Outcome units: Depending on the CDFI’s core lending sectors, may include housing units, education seats, jobs preserved or created, or other indicators.
  • Geographic impact: Heat map showing neighborhoods, counties, or states where capital has been deployed.
#5: The Investor Dashboard
Investors in CDFIs want to be able to understand the financial security of their investment along with the social impact made. CDFI investors are notorious for having unique requirements. A tool like Microsoft’s Power BI, which supports easy replication and tweaking of custom dashboards, is a great option for CDFIs managing multiple investors.
Picture
  • Financial health indicators: Deployment ratio and net asset ratio.
  • Outcome units: Depending on the CDFI’s core lending sectors, may include housing units, education seats, jobs preserved or created, or other indicators.
  • Portfolio growth: Outstanding principal balance and outstanding number of loans over time.
  • Delinquency data: 30-60-90-day delinquencies and dollar amount of nonperforming assets.
  • Custom covenants: Tracking of financial or other covenants required to be met by the investor.

By making these dashboards easy to access and update, all your critical internal and external stakeholders will have the information they need to make sound, confident decisions.
​
High Impact configures and manages dashboards for CDFIs using our High Impact Portfolio Analytics Service in Microsoft Power BI. For more information, contact us at [email protected]. 
0 Comments


Leave a Reply.

    The High Impact Team

    RSS Feed

    Archives

    July 2024
    May 2024
    April 2024
    February 2024
    January 2024
    September 2022
    March 2022
    February 2022
    January 2019
    December 2018
    September 2018
    March 2018
    February 2018
    January 2018
    September 2017
    July 2017
    November 2016
    September 2016
    July 2016

High Impact Logo
69 State Street
Suite 1200D
​Albany, NY 12207
​
​P: (518) 599-0482
[email protected]
​About Us
Underwriting
Portfolio Management
Analytics
Contact
Picture
  • Home
  • About High Impact
    • Our Team >
      • Join Our Team
    • Annual Reports
  • Underwriting
    • Green Lending
    • For Real Estate Lenders
    • For Business Lenders
    • For NMTC Allocatees
    • Multi-Lender Underwriting
  • Portfolio Management
    • Full-Service Portfolio Management
    • Data-First Portfolio Management
  • Analytics
  • MEDIA
    • Blog
    • Impact Lenders Podcast
    • Publications
  • CONTACT