
Top Five Dashboards for CDFIs
AUGUST 2021
Dashboards provide critical insights through visual representations of key data and trends that are easy to interpret and direct focus to the most important information and takeaways… But they can be so much more! By incorporating targeted dashboards and interactive features, which allow users to dive into the data, key stakeholders can access the insights and advanced analytics they need to make stronger strategic decisions.
Effective dashboard packages utilize a combination of Summary and Supporting schedules. Summary dashboards focus on KPIs as well as key trends, ratios, and metrics, while supporting pages provide more granular insights and can leverage interactive features to support deeper analytics. For example, while a summary page might focus on total portfolio growth, supporting dashboards would include insights on the funds, products, and/or geographies driving that growth.
So, what information should you include in a CDFI dashboard package? That depends on your audience. CDFIs have many different stakeholders—both internal and external—and they all need different information to meet their needs. Remember, information overload can be just as detrimental as a lack of information. Connecting stakeholders to the right information so they can act upon it is your primary goal in designing a dashboard package.
This is where business intelligence software’s powerful analytical and distribution capabilities shine. Once data modeling is complete, you have full control over which content your various audiences can access. Here is our take on the top five dashboards that CDFIs need to ensure that the right data are available for the right stakeholders at all times.
|
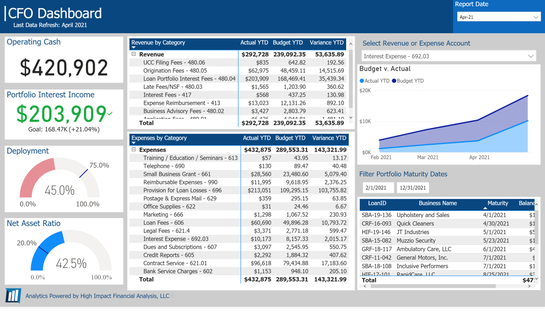
#1: The CFO Dashboard
CDFI CFOs have a lot to manage—not just income and expenses, but also asset-liability matching, deployment, and strategic planning. The perfect CFO dashboard gives key information on all of these topics.
|
|
|
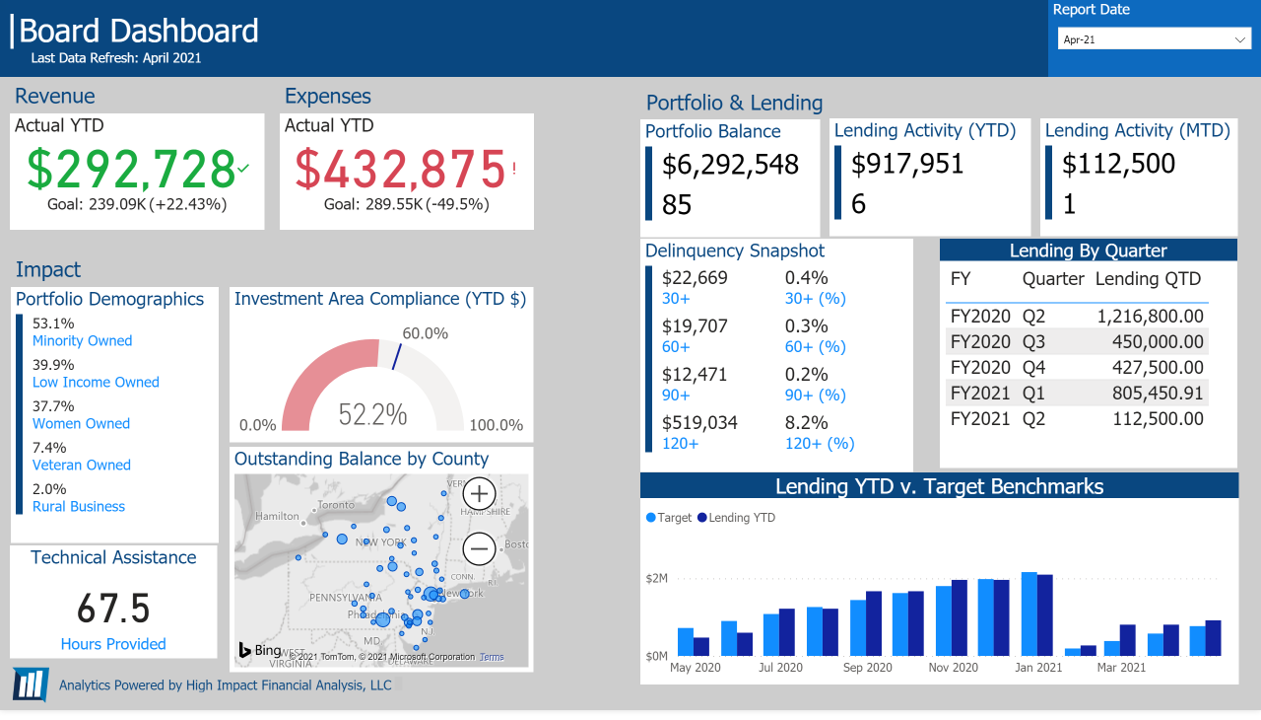
#2: The Board Dashboard
CDFI Boards of Directors are responsible for the overall strategy and oversight of the organization. Their needs are best met by monitoring the big-picture numbers and strategic direction. Adding in a taste of impact is critical.
|
|
|
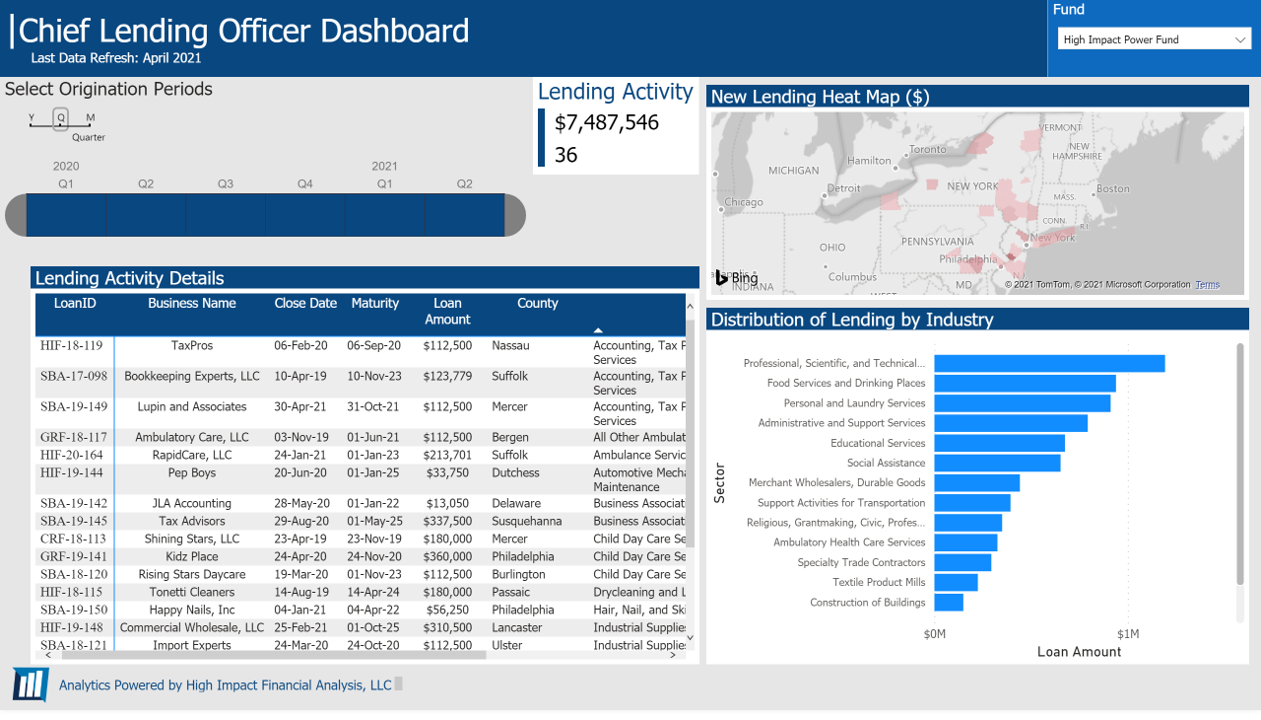
#3: The Chief Lending Officer Dashboard
Chief Lending Officers are often charged with both generating originations and ensuring that only good loans are made. An effective dashboard will keep an eye on both.
|
|
|
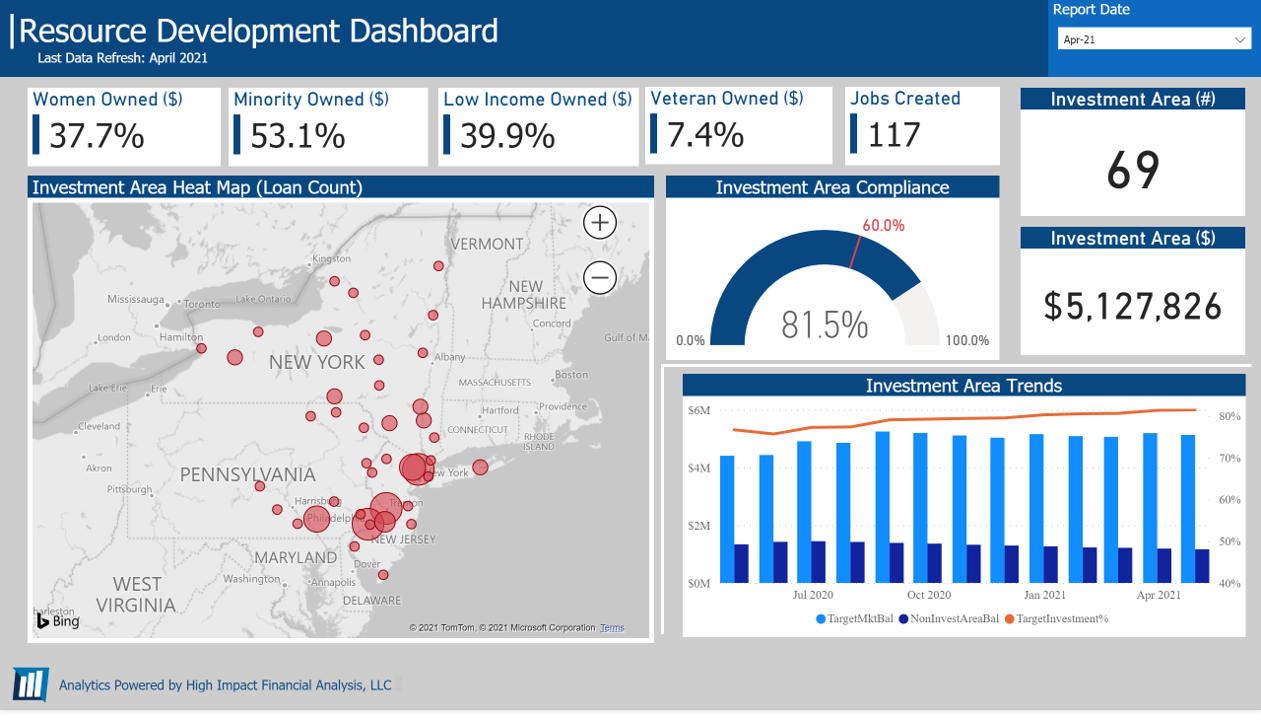
#4: The Resource Development Dashboard
Staff focused on raising funds need to be able to effectively tell the impact story of the loan fund. Equipping them with clear, concise dashboards that communicate the success of the CDFI is critical.
|
|
|
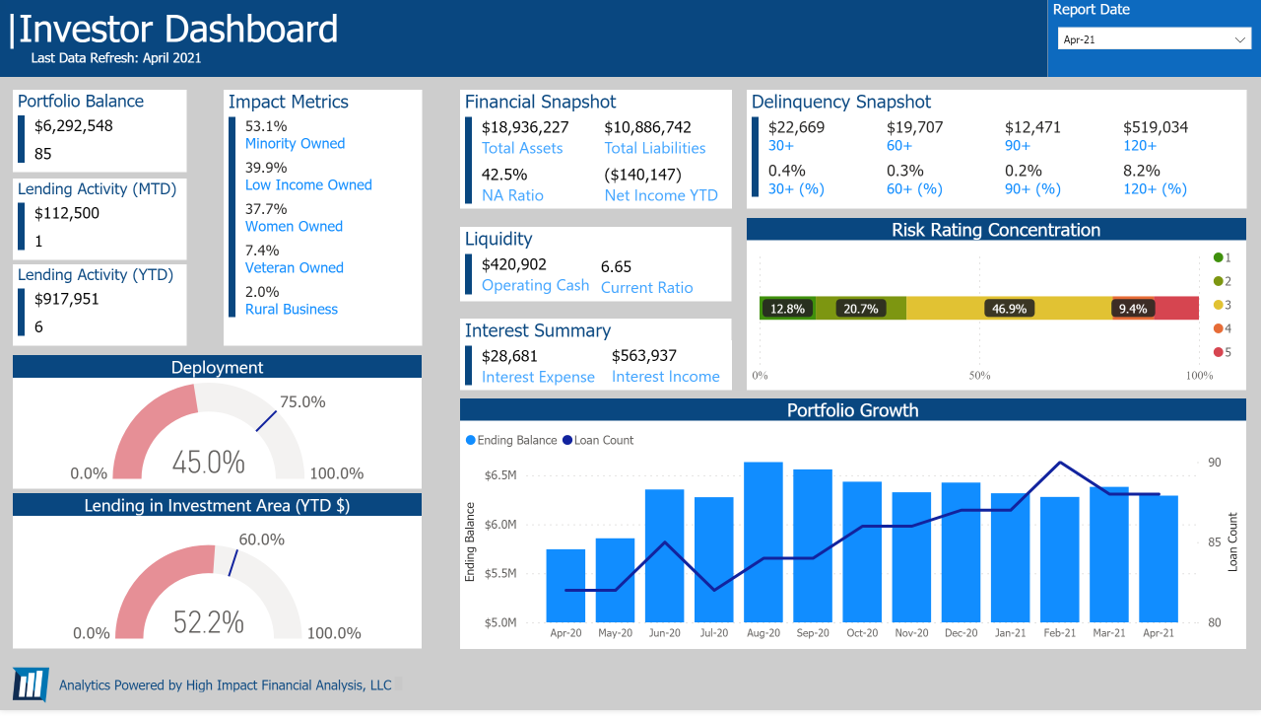
#5: The Investor Dashboard
Investors in CDFIs want to be able to understand the financial security of their investment along with the social impact made. CDFI investors are notorious for having unique requirements. A tool like Microsoft’s Power BI, which supports easy replication and tweaking of custom dashboards, is a great option for CDFIs managing multiple investors.
|
|
By making these dashboards easily accessible and up to date, all the critical internal and external stakeholders have access to the insights they need to make sound, confident decisions.
For more on how High Impact can help your CDFI set up and maintain effective dashboards, click here: http://www.highimpactanalysis.com/analytics.html.
For more on how High Impact can help your CDFI set up and maintain effective dashboards, click here: http://www.highimpactanalysis.com/analytics.html.